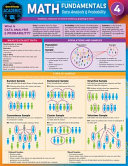
Math Fundamentals 4 - Data Analysis & Probability (QuickStudy Academic)
Peggy Warren, Susan Wright, Expolog, LLC
Essential core elements of mathematics to support early learning, continued development, and as a reference to review during and after building a strong foundation. Seeing a broad overview and how the details make the math possible in just 6 pages can melt away some math phobia and will strengthen skills and grades. Written and tested in a classroom over many years, two teachers came to us with this reference they used with their students. A math textbook authoring group then expanded the series. With experts in the classroom and in textbooks developing the content, don't pass up this 6 page laminated, inexpensive tool with the power to support the core areas of math students struggle with. Check other titles in the 5-guide series for the areas of support most needed. 6 page laminated guide includes: Ways to Collect Data Populations & Samples Types of Samples Random Sample Convenience Sample Systematic Sample Cluster Sample Stratified Sample Volunteer Sample Measures of Central Tendency Measures of Spread Range Interquartile Range (IQR) When to use Measures of Center & Spread Symmetric Distribution (also called Normal Distribution) Negatively Skewed Distribution (also called Left Skewed Distribution) Positively Skewed Distribution (also called Right Skewed Distribution) Interpretation of Graphs Ways to Prevent Misinterpretation of Graphs Graphing Data Checklist for Making Graphs Data Displays Pictograph, Frequency Table, Tally Marks Bar Graph, Double & Multiple Bar Graphs Stacked Bar Graph Two-Way Frequency & Relative Frequency Table Circle Graph (also called Pie Chart) & Steps to Make Circle Graph Scatter Plot & Steps to Make a Scatter Plot Box-and-Whisker Plot & Steps to Make a Box-and-Whisker Plot Histogram & Steps to Make a Histogram Distributions in Histograms Line Graph & Line Plot Stem-and-Leaf Plot Multiple Line Graph Double Stem-and-Leaf Plot Interpreting Statistics Interpolation / Extrapolation Normal Distribution Venn Diagram To determine if a set of data has any outliers: Matrix Disjoint Sets Interpreting the Venn Diagram Probability
年:
2021
出版社:
Quickstudy Reference Guides
语言:
english
页:
6
ISBN 10:
1423247272
ISBN 13:
9781423247272
文件:
PDF, 4.59 MB
IPFS:
,
english, 2021
 Amazon
  Barnes & Noble
  Bookshop.org
  转换文件
转换文件 更多搜索结果
 其他特权
其他特权 


关键词
关联书单